Standard Report: Tetrad Test Results
Overview
Analysis for the Tetrad data in Compusense uses a one-tailed binomial test.
Tetrad Analysis Options
When generating the Tetrad Standard Report, it is important to select the options that meet your analysis objectives. Go to Results > Reports > Create report. Click Filters and apply any necessary filters on your data before generating the report.
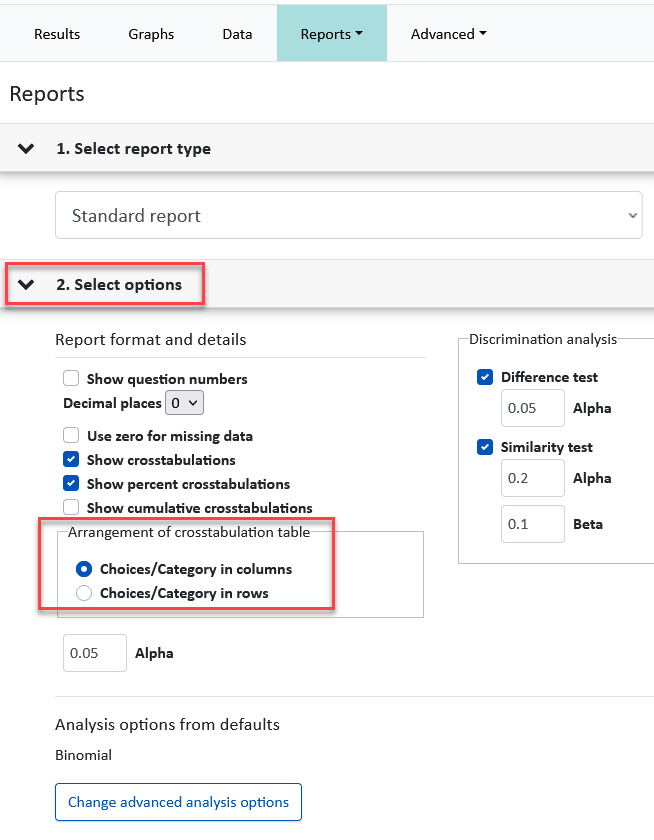
Select Standard report and expand the 2. Select options list to review all the options.
- Sensory discrimination (exact) analysis - This analysis is a statistical non-inferiority test (which in this case is a binomial test of the lower tail) and it aligns with the ASTM standard E3009-23a. This analysis type is used in the following Discrimination tests: Triangle, Tetrad, and Duo-Trio.
These options are selected by default. Any changes in the selections and values will be saved for the next time you run the report. - Difference test – Enter the Alpha you wish to use for this test or turn off the Difference Test analysis by removing the checkmark from the checkbox.Difference thresholds:Update the d' (d prime) by typing directly in the box. You will notice that the Pd and Pc values will automatically recalculate.If you update the Pd, then the d' and Pc values will automatically recalculate. Likewise, if you update the Pc value, the d' and Pd values will automatically recalculate.
- Equivalence test – An equivalence test is a statistical method used to demonstrate that two samples are practically the same within acceptable limits. Unlike traditional hypothesis tests, which assume equality and look for differences, an equivalence test starts by assuming the samples are different and seeks to prove they are “close enough.”
Control whether the Equivalence test analysis is included in the report by adding in or removing the checkmark from the checkbox. - Equivalence test for replications - This option is only compatible with Triangle tests, Tetrad test, and Duo-trio test and these tests have to have an experimental design where the same samples were presented to panelists at least twice (i.e the test includes repetitions). In other words, if your test is a single Tetrad or a back to back Tetrad with more than two samples, even if you select
this option, the equivalence analysis for reps is not applicable and
therefore will not be included in the report.
The Equivalence test for replications analysis is based on Meyners, M., Carr, B. T., & Kunert, J. (2023). Equivalence and non‐inferiority tests using replicated discrimination and preference data. Journal of Sensory Studies, 38(6), e12882. https://doi.org/10.1111/joss.12882
Control whether the Equivalence test for replications analysis is included in the report by adding in or removing the checkmark from the checkboxes.
Equivalence thresholds: - Alpha. The Alpha value is applicable to both the Equivalence test and Equivalence test for replications. The default value is 0.05. Update as necessary.
- d'. The d-prime value is applicable to the Equivalence test only. Update as necessary. You will notice
that the Pd and Pc values will automatically recalculate.
- Pd. The Proportion of distinguishers value is applicable to both the Equivalence test and Equivalence test for replications. If you
update the Pd, then the d' and Pc values will automatically
recalculate.
- Pc. The Proportion correct value is applicable to the Equivalence test only. If you update the Pc value, the d' and Pd values
will automatically recalculate.
- Discrimination analysis - This analysis follows the formulas published in the Sensory evaluation techniques by Meilgaard et al. This analysis has been included in Compusense since this test type was originally implemented in Compusense. These analyses options are not selected by default, but if you make any changes to the selections, they will be saved for you moving forward until you make different selections.
- Difference Test
- This is the default analysis. Change the Alpha value if desired, or turn off the
Difference Test analysis by removing the checkmark from the checkbox.
- Similarity Test - Analysis type used in Discrimination tests (Triangle, Tetrad, Same/Different,
3-AFC, Duo-Trio, 2-out-of-5, A-not-A, and Torgerson's) when high
confidence is required that the samples are perceived the same. This
analysis can be used in quality control tests, for example. Turn the
Similarity Test analysis on or off when generating the report.
Set the Alpha and Beta values according to your company standards.
Tetrad Standard Report Details
What is included in the report will depend on what you selected before generating the report, as described in the previous section of this workflow.
Report and Sample Details
The Standard report for Tetrad question data includes the following information about the report itself and about the samples:
- Test Name: This is the name specified in the Overview tab of the test, visible to analysts in the software, and in the reports.
- Number of Evaluations: The number of completed and/or in progress evaluations included in the report. Whether the 'in progress' evaluations are included in the report will depend on the filters applied before generating the report.
- Test Completion Date: If you set your test to Complete before generating the report, the date when you set the test to complete will be displayed here. No date will be shown if the test is not set to Complete.
- Samples: A table containing the information about the samples in the test that were included in the report.
Sensory Discrimination (Exact) Analysis
Difference Test
- Above the table, the following information is displayed:
- The threshold values specified by the user before generating the report.
- Statement on how conclusions are made based on the selected alpha. The confidence % is the only value that will change in this statement depending on the Alpha value specified before the report was generated.
- The table displays the following details:
- p-value: The p-value for each tetrad test.
- Responses Required: The minimum number of correct responses necessary to reach the conclusion of Different.
- Conclusion: A conclusion is made based on whether the difference between samples is significantly larger than the difference threshold.
- Tetrad test number: Our example screenshot with numbered bubbles shows that a back to back Tetrad was ran; therefore there is the Tetrad 1 and Tetrad 2 row.
- Pooled: In the analysis where two samples (see the Samples table in our example
above) were evaluated back to back, the N is increased by multiplying
the actual N by the number of tests. Each test is treated as done by
different panelists even though they were seen back to back by the same
panelists. Pooled analysis is not available in single tests and in any
other variation of back to back tests (e.g. more than two tests on two
samples, or more than two sample tests).
- Both Tetrads: In a back to back Tetrad analysis (true replicate of two samples), you
can see how many panelists answered both Tetrad tests correctly. The
probability of panelists correctly sorting the samples for both tests by
chance decreases. Both Tetrads analysis is not available in single
tests and in any other variation of back to back tests (e.g. more than
two tests on two samples, or more than two sample tests).
Equivalence Test
- Above the table, the following information is displayed:
- The threshold values specified by the user before generating the report.
- Statement
on how conclusions are made based on the selected Alpha. The confidence
% is the only value that will change in this statement depending on the
Alpha value specified before the report was generated.
- The table displays the following details:
- p-value: The p-value for each tetrad test.
- Responses Required: The maximum number of correct responses permitted to reach the conclusion of Equivalent.
- Conclusion: A conclusion is made based on whether the difference between samples is significantly larger than the equivalence threshold.
- Tetrad test number:
Our example screenshot with numbered bubbles shows that a back to back
Tetrad was ran; therefore there is the Tetrad 1 and Tetrad 2 row.
- Pooled: In the analysis where two samples (see the Samples table in our example
above) were evaluated back to back, the N is increased by multiplying
the actual N by the number of tests. Each test is treated as done by
different panelists even though they were seen back to back by the same
panelists. Pooled analysis is not available in single tests and in any
other variation of back to back tests (e.g. more than two tests on two
samples, or more than two sample tests).
- Both Tetrads: In a back to back Tetrad analysis (true replicate of two samples), you
can see how many panelists answered both Tetrad tests correctly. The
probability of panelists correctly sorting the samples for both tests by
chance decreases. Both Tetrads analysis is not available in single
tests and in any other variation of back to back tests (e.g. more than
two tests on two samples, or more than two sample tests).
Equivalence Test For Replications
If your test is a single Tetrad or a back to back Tetrad with more than two samples, even if you selected this option, the equivalence analysis for reps is not applicable and
therefore will not be included in the report.
- Above the table, the following information is displayed:
- Pd. The proportion of distinguishers value.
- Alpha. The Alpha value specified by the user before generating the report.
- X. The total number of correct responses.
- n. The total number of evaluations, not counting reps.
- k. The number of reps included in the analysis.
- The table displays the following details:
- Samples. The pairs of samples analyzed for equivalence in reps. Your test may have multiple pairs of different samples, but only those that were evaluated as repetitions (or replicates) will be listed in the table.
- Responses Required. The maximum number of correct responses required for a conclusion that the samples are equivalent. In our example screenshot above, we can see that there were 43 correct responses, which is greater than 36, which makes the samples not equivalent.
- p-value. The p-value.
- Conclusion. A conclusion is made whether the samples evaluated in replicates are equivalent or not.
Supporting tables
Proportion Correct:
- N: Total number of evaluations included in the report.
- Correct: Count of correct responses (where the same samples were identified correctly).
- Incorrect: Count of incorrect responses (where the same samples were not identified correctly).
- Estimate Pc: Estimated proportion correct.
Formula: Pc = c / n
Where:
c = number of correct responses.
n = total number of evaluations. - SE: Standard error of the estimate of the proportion of (momentary) discriminators.
- LCL: Lower confidence limit at the Alpha specified before generating the report.
- UCL: Upper confidence limit.
- Tetrad test number:
Our example screenshot above, with numbered bubbles, shows that a back to back
Tetrad was ran; therefore there is the Tetrad 1 and Tetrad 2 row.
- Pooled: In the analysis where two samples (see the Samples table in our example
above) were evaluated back to back, the N is increased by multiplying
the actual N by the number of tests. Each test is treated as done by
different panelists even though they were seen back to back by the same
panelists. Pooled analysis is not available in single tests and in any
other variation of back to back tests (e.g. more than two tests on two
samples, or more than two sample tests).
- Both Tetrads: In a back to back Tetrad analysis (true replicate of two samples), you can see how many panelists answered both Tetrad tests correctly. The probability of panelists correctly sorting the samples for both tests by chance decreases. Both Tetrads analysis is not available in single tests and in any other variation of back to back tests (e.g. more than two tests on two samples, or more than two sample tests).
Proportion of momentary discriminators (Pd):
- Estimate Pd: Estimated proportion of distinguishers.
- LCL: Lower confidence limit at the Alpha specified before generating the report.
- UCL: Upper confidence limit.
- Tetrad test number:
Our example screenshot with numbered bubbles shows that a back to back
Tetrad was ran; therefore there is the Tetrad 1 and Tetrad 2 row.
- Pooled: In the analysis where two samples (see the Samples table in our example
above) were evaluated back to back, the N is increased by multiplying
the actual N by the number of tests. Each test is treated as done by
different panelists even though they were seen back to back by the same
panelists. Pooled analysis is not available in single tests and in any
other variation of back to back tests (e.g. more than two tests on two
samples, or more than two sample tests).
- Both Tetrads: In a back to back Tetrad analysis (true replicate of two samples), you can see how many panelists answered both Tetrad tests correctly. The probability of panelists correctly sorting the samples for both tests by chance decreases. Both Tetrads analysis is not available in single tests and in any other variation of back to back tests (e.g. more than two tests on two samples, or more than two sample tests).
d prime:
- d' (read d prime): The measure of the extent of the overlap of panelist perception. It is the distance between the means of the two distributions measured in terms of their standard deviation.
The larger the d’ value, the samples are more different. Where the d' value is 0 it means that the samples are indistinguishable. A d’ of 1 or less might be considered small and a d’ of 2 or more might be considered large, but it depends on various factors.
This calculation is always done treating each response as independent, as if the test is unreplicated. For example, d' on a back-to-back test with 50 assessors who provide 2 responses, calculation is done as if there are 100 assessors who provide 1 response each. - LCL: Lower confidence limit at the Alpha specified before generating the report.
- UCL: Upper confidence limit.
- Tetrad test number:
Our example screenshot with numbered bubbles shows that a back to back
Tetrad was ran; therefore there is the Tetrad 1 and Tetrad 2 row.
- Pooled: In the analysis where two samples (see the Samples table in our example
above) were evaluated back to back, the N is increased by multiplying
the actual N by the number of tests. Each test is treated as done by
different panelists even though they were seen back to back by the same
panelists. Pooled analysis is not available in single tests and in any
other variation of back to back tests (e.g. more than two tests on two
samples, or more than two sample tests).
- Both Tetrads: In a back to back Tetrad analysis (true replicate of two samples), you can see how many panelists answered both Tetrad tests correctly. The probability of panelists correctly sorting the samples for both tests by chance decreases. Both Tetrads analysis is not available in single tests and in any other variation of back to back tests (e.g. more than two tests on two samples, or more than two sample tests).
Discrimination Analysis
If included in the report, the tables described below are generated based on the standards for Tetrad testing that existed prior to the implementation of the new ASTM standards.
The formula that you can use in Excel to reproduce the same analysis is as follows:
=1-BINOMDIST(x-1,n,0.3333333333333,TRUE)
Where:
Where:
- x-1 = number of correct responses minus 1
- n = total number of evaluations included in the analysis
Difference Test
- Chance. Probability of panelists correctly sorting the sample properly by chance.
- N. Total number of evaluations included in the report.
- Correct. Count of correct responses.
- Incorrect. Count of incorrect responses.
- d' (read d prime). The measure of the extent of the overlap of panelist perception. It is the distance between the means of the two distributions measured in terms of their standard deviation.
The larger the d’ value, the samples are more different. Where the d' value is 0 it means that the samples are indistinguishable. A d’ of 1 or less might be considered small and a d’ of 2 or more might be considered large, but it depends on various factors.
This calculation is always done treating each response as independent, as if the test is unreplicated. For example, d' on a back-to-back test with 50 assessors who provide 2 responses, calculation is done as if there are 100 assessors who provide 1 response each. - p-value. The probability of observing an outcome that is more extreme than or equal to the test statistic observed assuming that the null hypothesis is true.
- Significant at an Alpha level. Indicator whether there is a significant difference between samples at the specified level of significance (Alpha). The default Alpha value is 0.05, but it can be changed in the results area when generating the report.
- Tetrad test number. Our example screenshot above, the one with numbered bubbles shows that a back to back Tetrad was ran on two samples. Below is an example of a back to back Tetrad analysis for four samples.
- Pooled. In the analysis where two samples (see the Samples table in our example above) were evaluated back to back, the N is increased by multiplying the actual N by the number of tests. Each test is treated as done by different panelists even though they were seen back to back by the same panelists. Pooled analysis is not available in single tests and in any other variation of back to back tests (e.g. more than two tests on two samples, or more than two sample tests).
- Both Tetrads. In a back to back Tetrad analysis (true replicate of two samples), you can see how many panelists answered both Tetrad tests correctly. The probability of panelists correctly sorting the samples for both tests by chance decreases. Both Tetrads analysis is not available in single tests and in any other variation of back to back tests (e.g. more than two tests on two samples, or more than two sample tests).
Similarity Test
- N. Total number of evaluations included in the report.
- Correct. Count of correct responses (where the same samples were identified correctly).
- Responses Required. The maximum number of correct responses permitted to reach a conclusion of Similar.
- Conclusion. When the number of correct responses is smaller than the responses required, the samples are deemed similar. When the number of correct responses is equal to or greater than the responses required, the samples are deemed not similar.
- Pc(estimate). Proportion correct.
Formula: Pc = c / n
Where:
c = number of correct responses.
n = total number of evaluations. - Pd(estimate). Proportion of distinguishers.
Formula: Pd = (Pc - Pg) / (1 - Pg)
Where:
Pc = proportion correct.
Pg = guessing probability. - Std error (Pd). Standard error of the estimate of the proportion of (momentary) discriminators.
Formula: (1 / (1 - Pg)) * sqrt(Pc * (1 - Pc) / n)
Where:
Pg = guessing probability.
sqrt = square root.
Pc = proportion correct. - Pmin, Lower confidence limit (α=0.2).
Formula: Pmin = Pd + Zalpha * Std error (Pd)
Where:
Pd = proportion of distinguishers.
Zalpha = Alpha value. The default Alpha value is 0.10, but it can be changed before generating the report.
Std error (Pd) =Standard error of the estimate of the proportion of (momentary) discriminators. - Pmax, Upper confidence limit (β=0.01).
Formula: Pmax = Pd + Zbeta * Std error (Pd)
Where:
Pd = proportion of distinguishers.
Zbeta = Beta value. The default Beta value is 0.10, but it can be changed before generating the report.
Std error (Pd) =Standard error of the estimate of the proportion of (momentary) discriminators. - Tetrad test number. Our example with numbered bubbles shows that a back to back Tetrad was
ran on two samples. Below is an example of a back to back Tetrad
analysis for four samples.
- Pooled. In the analysis where two samples were evaluated back to back, the N is increased by multiplying the actual N by the number of tests. Each test is treated as done by different panelists even though they were seen back to back by the same panelists. Pooled analysis is not available in single tests and in any other variation of back to back tests (e.g. more than two tests on two samples, or more than two sample tests).
- Both Tetrads. In a back to back Tetrad analysis (true replicate of two samples), you can see how many panelists answered both Tetrad tests correctly. The probability of panelists correctly sorting the samples for both tests by chance decreases. Both Tetrads analysis is not available in single tests and in any other variation of back to back tests (e.g. more than two tests on two samples, or more than two sample tests).
Additional Tetrad Analysis
If your test included a follow up Tetrad related Comment or a Tetrad related Choose question, your Standard report will provide you with Tetrad related Comments or Tetrad related Choose data, depending on what question type you added into your test. Let's review what each follow up question provides in the Standard report.
Tetrad Related Comments
When Tetrad related comments are collected, the analysis will separate the panelists' comments based on their correct and incorrect Tetrad responses. In our example below, we can see that the panelist #5 correctly evaluated both Tetrads and his or her comments for both tests are in the table labeled Correct response related comments.
The Incorrect response related comments table displays the comments for all the incorrect Tetrad responses. Our example does not have any comments in it because our example test was set up with connections. The connections did not allow panelists who answered the Tetrad incorrectly to comment, however, the table still shows individual panelists and the Tetrad test # that they did not evaluate correctly.
The Incorrect response related comments table displays the comments for all the incorrect Tetrad responses. Our example does not have any comments in it because our example test was set up with connections. The connections did not allow panelists who answered the Tetrad incorrectly to comment, however, the table still shows individual panelists and the Tetrad test # that they did not evaluate correctly.
Tetrad Related Choose Data
When a Tetrad related Choose data is collected, the analysis will display the Crosstabulation and Percentage Crosstabulation tables based on panelists' correct and incorrect Tetrad responses.
- Count of choice selections for correct Tetrad responses.
- Count of choice selections for incorrect Tetrad responses.

To change the Crosstabulation format, when generating the Standard report in the Results area, expand Select options and choose what works best for your analysis needs.
Panelist Performance Report
Run a Panelist Performance report in the Panelists library to see how your panelists have performed over multiple Tetrad tests over time, allowing you to discover patterns or non-differentiators. The workflow for the report will be available soon.
Data
You can use the Data tab for another quick and easy insight into panelist performance within a single test (rather than across multiple tests as described above). The example screenshot below was taken in a test that had a back to back Tetrad scenario where two different samples were evaluated in each Tetrad (4 samples in total).
Graphs
The data from single and back to back Tetrads with two samples can also be graphed. To generate the graph:
- In the Results area, click the Graphs tab.
- In the left sliding pane, select the Tetrad question.
- Update any of the parameters in the right sliding pane.
Graphs cannot be generated on Tetrad related comment and CATA questions, and on back-to-back Tetrads with 4 or more samples.
Related Articles
Standard Report: Duo-Trio Test Results
Overview Analysis of Duo-Trio data in Compusense is performed using a one‑tailed binomial test. The analysis outcome will depend on the setting you selected for the Panelist asked to select sample which is option in the Question options. It is very ...Tetrad Test
Overview Tetrad test is a discrimination test type that helps you determine if there is a difference between two products by asking panelists to group the four samples into 2 groups of 2. This highly recommended method is useful for a wide range of ...Standard Report Review
Overview The Standard Report provides a breakdown of results by attributes (where applicable) and samples, as well as the analysis that was selected while generating the report. Question Compatibility The report is compatible with the following ...Question Type: Tetrad
Overview Tetrad test is a discrimination test type that helps you determine if there is a difference between two products by asking panelists to group 4 samples into 2 groups of 2. Unlike most other question types, the Tetrad question is not ...Standard Report: Single Triangle Test Results
Overview The Standard Report for Single Triangle test data can provide the following analysis: Sensory discrimination (exact) analysis. This analysis is a statistical non-inferiority test (which in this case is a binomial test of the lower tail) and ...